From
Martin Peters
March 3, 2026
5 minutes
Engineering

Every active part number in a company costs money. Not just in design, but throughout the entire lifecycle: procurement, inventory management, quality assurance, production planning, documentation, service. In professional literature, these so-called part number costs are well documented. Ehrlenspiel et al. estimate them at 1,500 to 2,000 euros per year for purchased components, and 3,000 to 3,500 euros for in-house manufactured parts — in extreme cases, administrative costs of up to 12,000 euros per part number per year are known (Ehrlenspiel, K., Kiewert, A., Lindemann, U. & Mörtl, M.: Cost-effective Design and Engineering, 7th edition, Springer Vieweg, 2014, ISBN 978-3-642-41958-4). These figures align with what we regularly observe in customer projects.
These are not abstract numbers. A mid-sized machinery manufacturer with 20,000 active part numbers, of which 15% are redundant or can be consolidated, incurs additional costs of 6 to 10 million euros annually. Note: These costs do not result from a lack of individual designers' skills but from the absence of systematic and methodological support in the design process.
And yet, this inventory grows steadily in most companies. Not because every new part is needed, but because there are no reliable search mechanisms or automatic checks to prevent the redesign of something existing. A designer under time pressure will redraw a part rather than spend hours searching the file system for an equivalent counterpart. This is not an individual's failure — it is a systemic problem. The classic counterargument — clear nomenclatures, consistently maintained feature lists, binding naming rules — sounds convincing in theory. In practice, it fails due to reality: Conventions change, employees move, and no company consistently ensures that hundreds of designers stick to the same rules for years.
The obvious answer is: “We have a PLM system for that.” But this answer falls short.
The PLM Paradox
Even in large companies, PLM is not a universal standard — and in the broader mid-sized sector, the reality is quite different: The majority of manufacturing companies operate without a full-fledged PLM. Most manage CAD data with folder structures, on network drives, or at best with a simple file management system. In practice, this means thousands of CAD files in various formats — often from multiple CAD systems, due to mergers, customer requirements, or historically grown departmental structures — STEP, IGES, SolidWorks (.sldprt), CATIA (.CATPart), Siemens NX (.prt), Creo/Pro-E (.prt), Inventor (.ipt) — spread across project folders, named based on internal conventions that have changed multiple times over the years. The institutional memory of what is where and why exists at best in the minds of long-term employees.
But even where a PLM is in place, it rarely solves the fundamental problem. Why? PLM systems are primarily designed for document management and version control, not for geometric analysis. Similarity search is an add-on module that must be separately licensed and configured. And even if available, it only searches the PLM-managed inventory — historical data on network drives or in legacy formats remain invisible.
The issue of similarity search is well known to PLM manufacturers. Siemens offers Geolus Shape Search as an add-on for Teamcenter, PTC has integrated geometric duplicate detection with Windchill AI, and Dassault uses EXALEAD for 3D similarity search within the 3DEXPERIENCE platform. Third-party providers like CADENAS PARTsolutions can also be integrated into major PLM systems. So, the technology exists — at least as an additional module.
In practice, however, we see that these features are surprisingly seldom used. They are often licensed as optional add-ons, not as a core part of the PLM workflow. Even when activated, they typically function as single-part searches: A designer takes a specific model and looks for similar parts. What they don't typically provide is a systematic analysis of the entire parts inventory — a cluster analysis that proactively makes part families, duplicates, and consolidation candidates visible across the entire data inventory. Additionally, these features operate only within the PLM-managed inventory. Historical data on network drives, legacy inventories in other formats, or parts from acquired component structures are excluded. They naturally only assist companies that even use a PLM.
As a result, the search for existing parts in most companies still relies on file names, part number conventions, and individual employees' memories. This might work for a few hundred parts, but not for tens of thousands.
Additionally, there's a pattern that is not immediately visible: Parts are not exactly recreated, but with slight deviations — a different radius, a slightly varied wall thickness, a slightly changed hole position. Constructively, a single part would do. But the deviations are too subtle to be picked up by a part number search or a PLM match, so two separate part numbers exist — with all the follow-up costs along the entire value chain: two sets of drawings, two manufacturing releases, two storage locations, two quality assurance plans, duplicate tooling. Clear nomenclatures don't help here — because the deviations are geometric, not in the file name.
The result is complexity costs that are temporally and organizationally detached from the actual design decision. The designer who creates a slightly altered part doesn’t see the follow-up costs — they arise weeks or months later during production planning, procurement, and storage. They spread over manufacturing, assembly, and service. And they accumulate year after year.
Making CAD Models Mathematically Comparable
The solution is within the CAD model itself. The 3D geometry contains all necessary information to systematically compare parts — it just needs to be accessible to an algorithm.
The principle: Each CAD model is transformed into a mathematical representation. Dozens of key figures are extracted from the three-dimensional geometry — volume, surface area, bounding box proportions, complexity measures, curvature distributions. Together, they form a high-dimensional vector — a geometric fingerprint that numerically describes the part and makes it comparable to other parts. Two analysis methods become possible on this basis, which would be manually infeasible:
Similarity Search takes a reference part and automatically finds the geometrically most similar parts in the entire inventory. This operates independently of file names, project allocation, or part numbers. A part stored years ago under a cryptic designation in an archived project appears if its geometry is similar enough.
Cluster Analysis flips the perspective: Instead of starting from a single part, the entire parts inventory is automatically sorted into groups of geometrically similar parts. This reveals part families that no one recognized as such before. Where a company previously assumed they had "a few similar flanges," the cluster analysis might show 40 variations of the same base geometry — developed over years in various projects by different designers. Standardization opportunities become tangible, and candidates for consolidation can be systematically identified.
Here are two examples from our CAD analysis service:
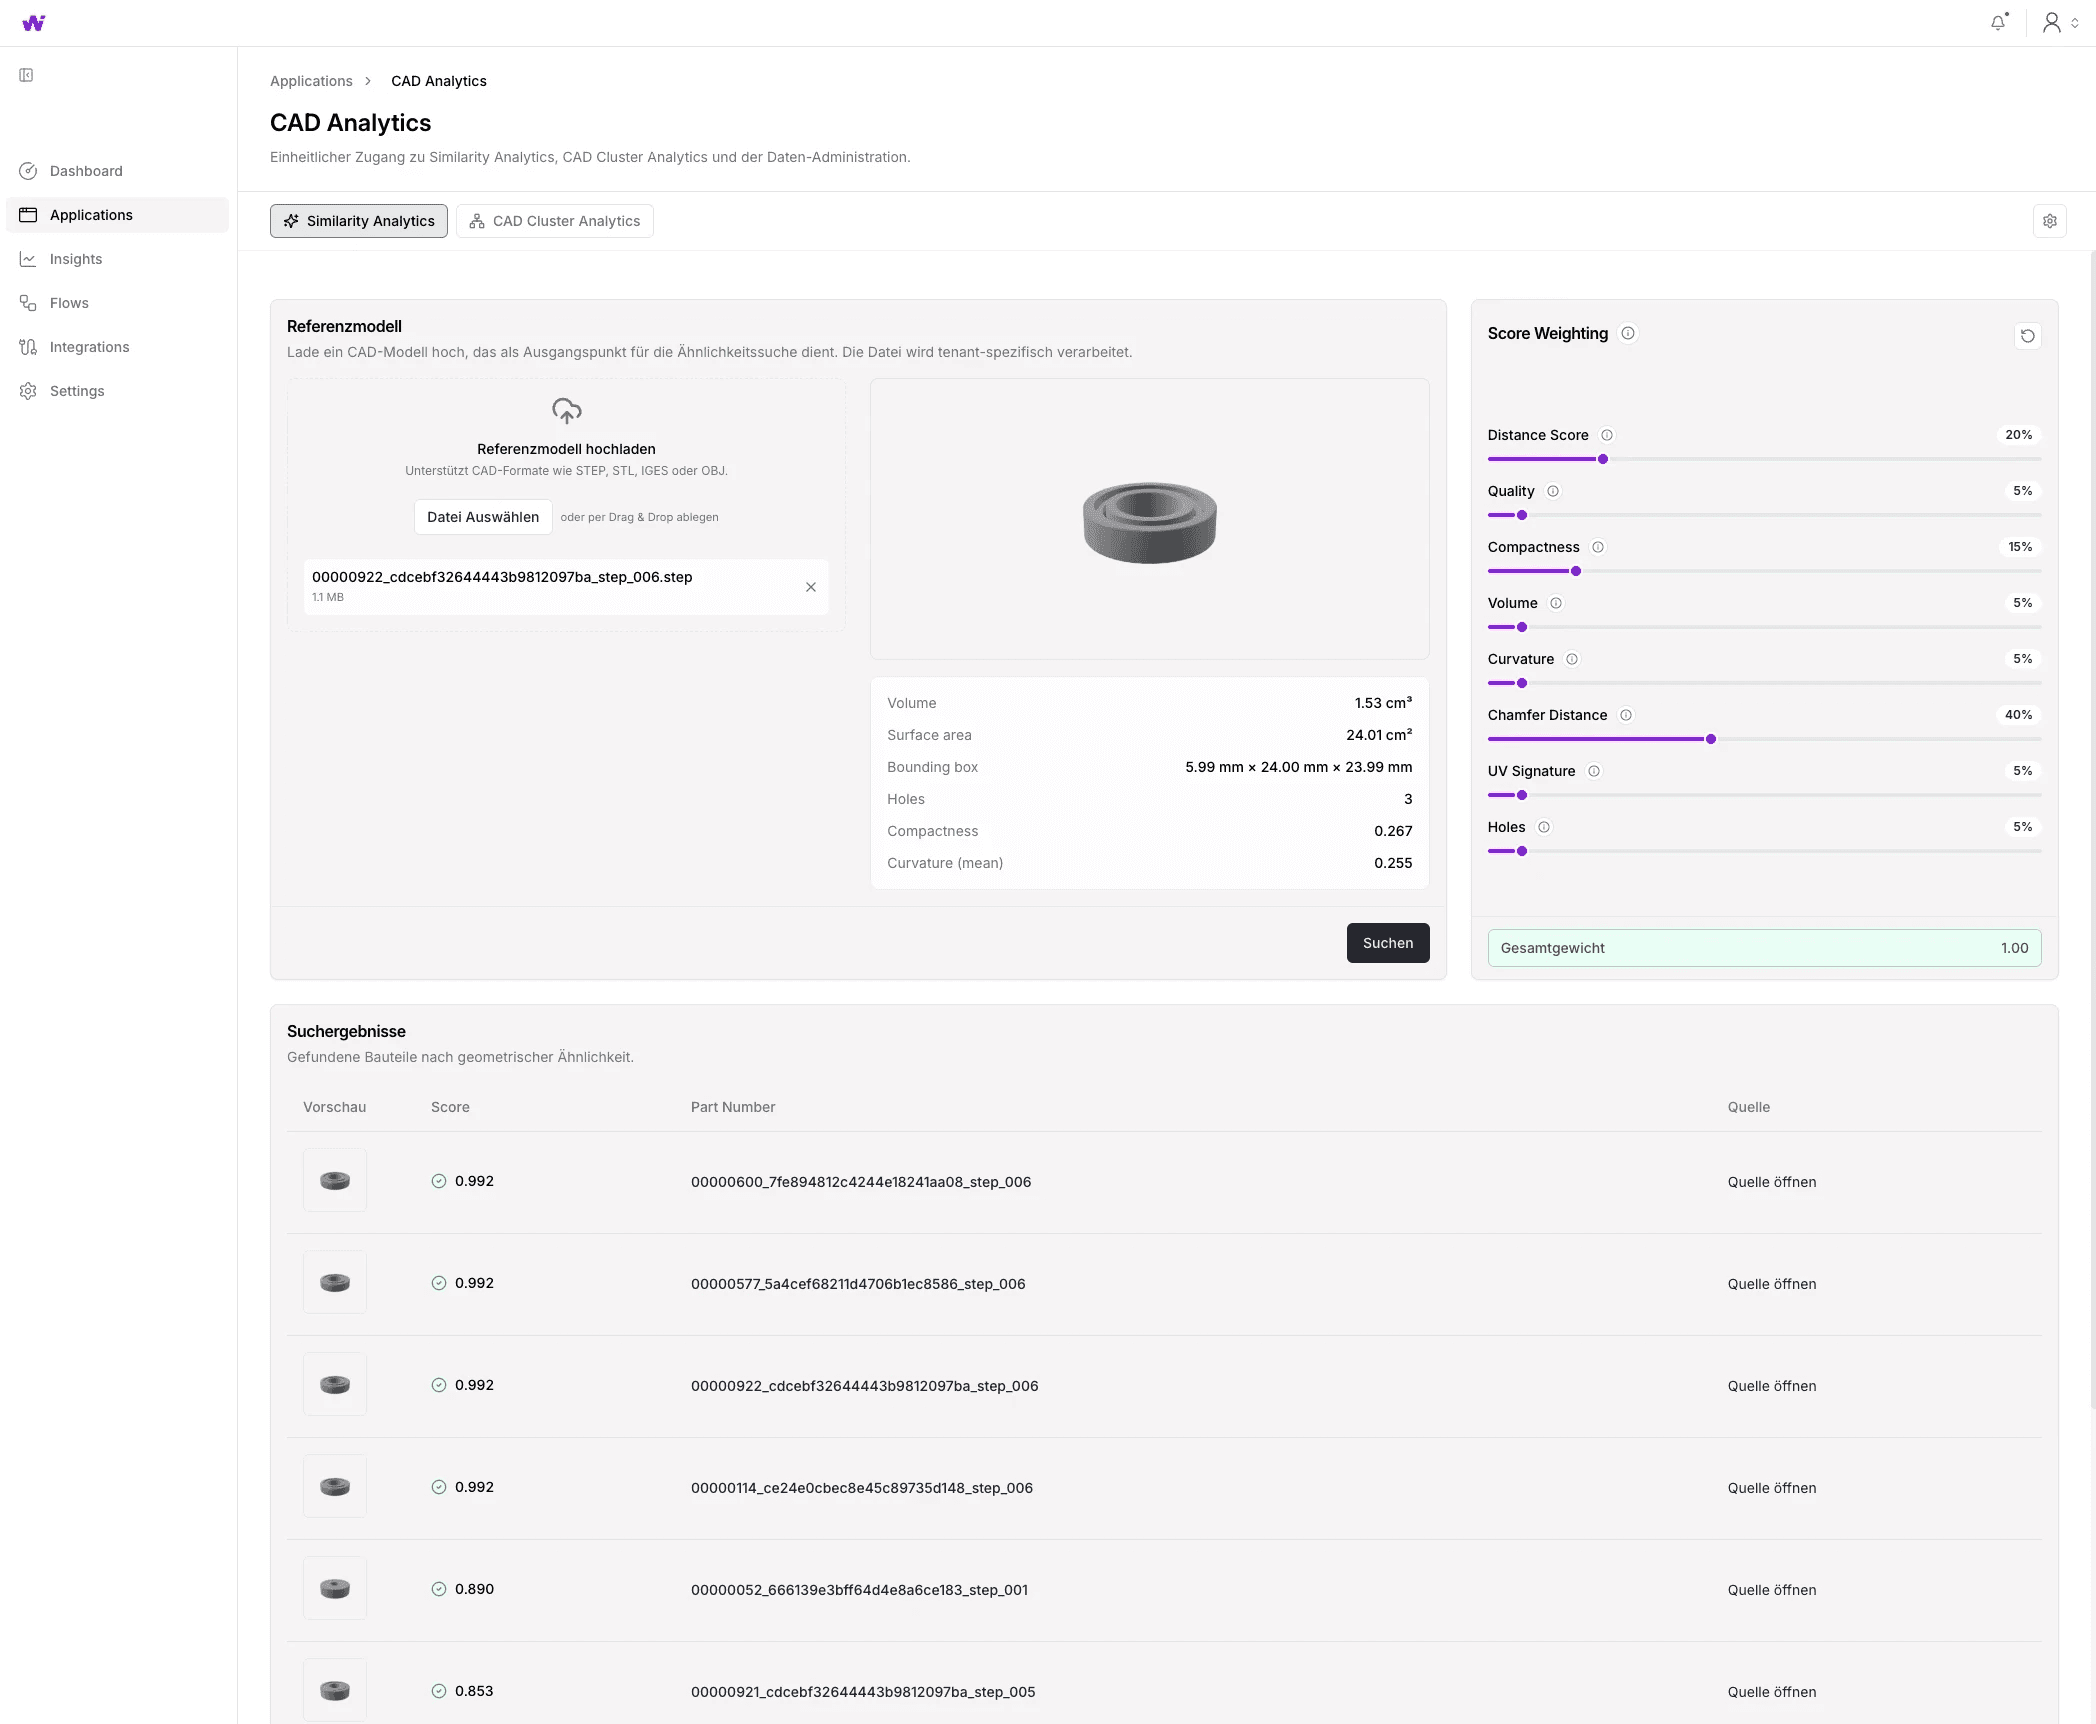
The similarity search delivers a hit list for a reference part with matching scores — sorted by geometric match, independent of file names or project affiliation. The weighting for the score composition can be individually adjusted.
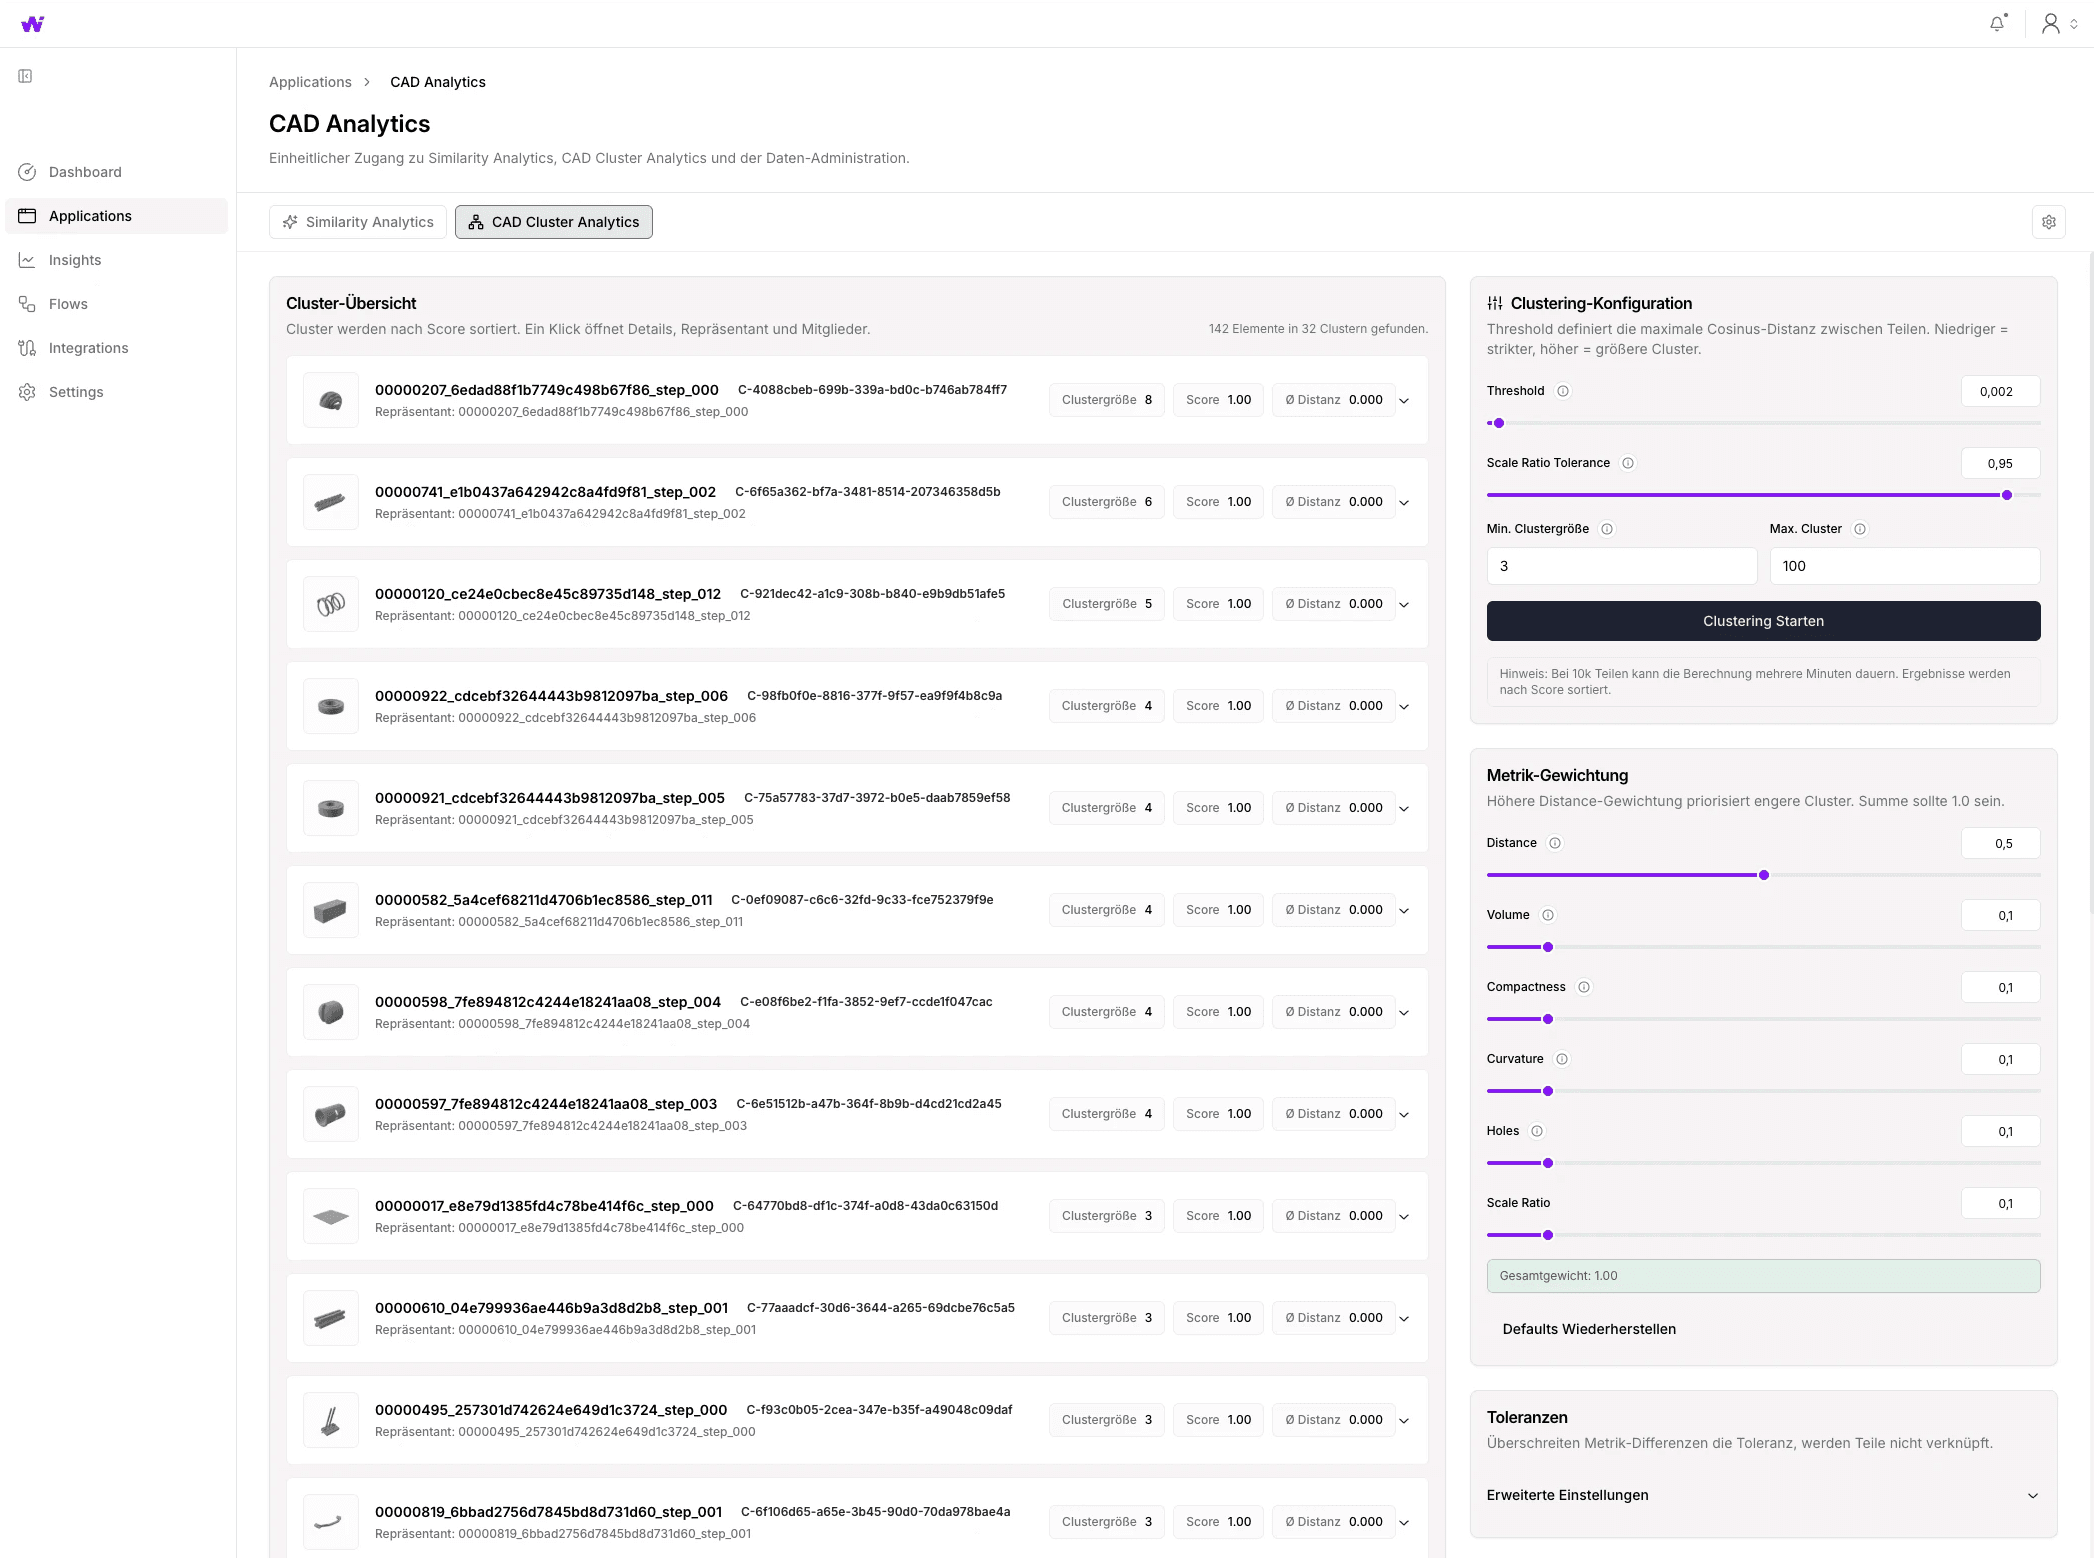
The cluster analysis automatically groups the entire parts inventory into families of geometrically related parts. It becomes visible at a glance where variants exist that could be consolidated. Here, too, the search can be fine-tuned through parameterization. For example, clusters can be formed over parts with high geometric similarity but different size ratios (scaling).
We applied this approach for a client and identified about 15% of the parts inventory as duplicates or consolidation candidates — primarily pipes and flanges. Some were exact 1:1 duplicates — parts that existed multiple times under different part numbers without anyone knowing. But also parts with slight design deviations that could have been reduced to a single part. These similar parts are the biggest leverage, as they don’t appear in any traditional duplicate search.
The economic impact is easy to calculate: With part number costs of 3,000 euros per in-house part annually, eliminating 300 unnecessary part numbers means saving almost a million euros — annually, and recurrently. This calculation is conservative — it’s based on average values, while certain part types cause significantly higher follow-up costs.
The key point is: This approach works directly on CAD files. It requires no PLM, no maintained metadata, no manual tagging. Geometry is the information.
From Comparing to Understanding
Similarity analysis and clustering are an effective first step. But they only answer one question: Which parts look similar? The logical next step is another question: What is this part — and what does it mean for manufacturing?
If geometry can not only be compared but semantically interpreted, far-reaching possibilities emerge. Feature Recognition automatically detects what is in a model: holes, pockets, threads, fillets, chamfers — not as abstract geometry data, but as engineering information. The system doesn’t see "a cylinder with negative volume," but "a through-hole M8 with countersink."
On this basis, a bridge is possible that most companies lack today: the automatic linking of design data with manufacturing knowledge — and prospectively, even directly linking customer requirements with existing design data. If a system recognizes what features a part has, it can deduce which manufacturing processes are suitable, which tolerances are critical, and where cost drivers lie in the geometry.
In the future, an automated DFM check (Design for Manufacturing) could provide feedback to the designer during development — not just when the part reaches production planning and raises questions there. Production planning, in turn, gets similar historical work plans suggested based on recognized features, instead of starting from scratch. And costing can be done directly from the 3D model: not through manually maintained costing tables, but based on the actual geometric and manufacturing properties of the component.
All this reduces iteration loops between design and manufacturing — a bottleneck that costs weeks in many companies.
Geometric analysis and similarity search are not futuristic visions — they work today. Semantic interpretation and the resulting automation are the next development step, directly building on this foundation.
Conclusion
The parts inventory is one of the most underestimated cost drivers in mechanical engineering. The costs per part number are well documented, the mechanisms of unchecked growth are known — and yet most companies lack a systematic approach to address the problem. PLM systems don’t solve it because they manage files, not understand geometry. Manual search doesn’t scale. And with each year, the inventory continues to grow.
The technology to automatically analyze CAD models, compare, and make identical and similar parts visible exists today. It operates directly on 3D data, independent of existing IT infrastructure — no PLM required, no extensive metadata maintenance, no months-long implementation projects.
At wailand, we are building exactly that. Our 3D-CAD analysis identifies identical and similar parts in your inventory — automated, based on actual geometry, independent of your PLM status. The entry barrier is deliberately low: upload CAD files, let them be analyzed, use the results. No integration project, no lead time.
But the real strength lies a step further: Analysis alone detects duplicates — it doesn’t prevent new ones. Therefore, with wailand, we offer the possibility to integrate part matching directly into existing engineering processes. This occurs on two levels: When a designer has finished modeling a new part, it can automatically be checked before assigning a new part number, whether an identical or similar part already exists. That is the first leverage. The second lever kicks in even earlier: Based on incoming requirements — such as a customer specification sent via email — it is possible to automatically identify matching parts with the required characteristics in the inventory. Even before a designer starts modeling, the answer is available: This part already exists, or one with minimal adjustment fits. This not only prevents duplicate part numbers but also double design work.
And for the existing inventory, we support targeted further processing of identified duplicates: consolidate, standardize, or deliberately retain. CAD data are a central information carrier in engineering. Understanding them is the prerequisite for fully automating engineering processes — from requirements through design to manufacturing. CAD analysis is a component of our automation platform, creating this integration.
Would you like to test similarity or cluster analysis on your data? Contact us!